Explore Our New Feature Releases
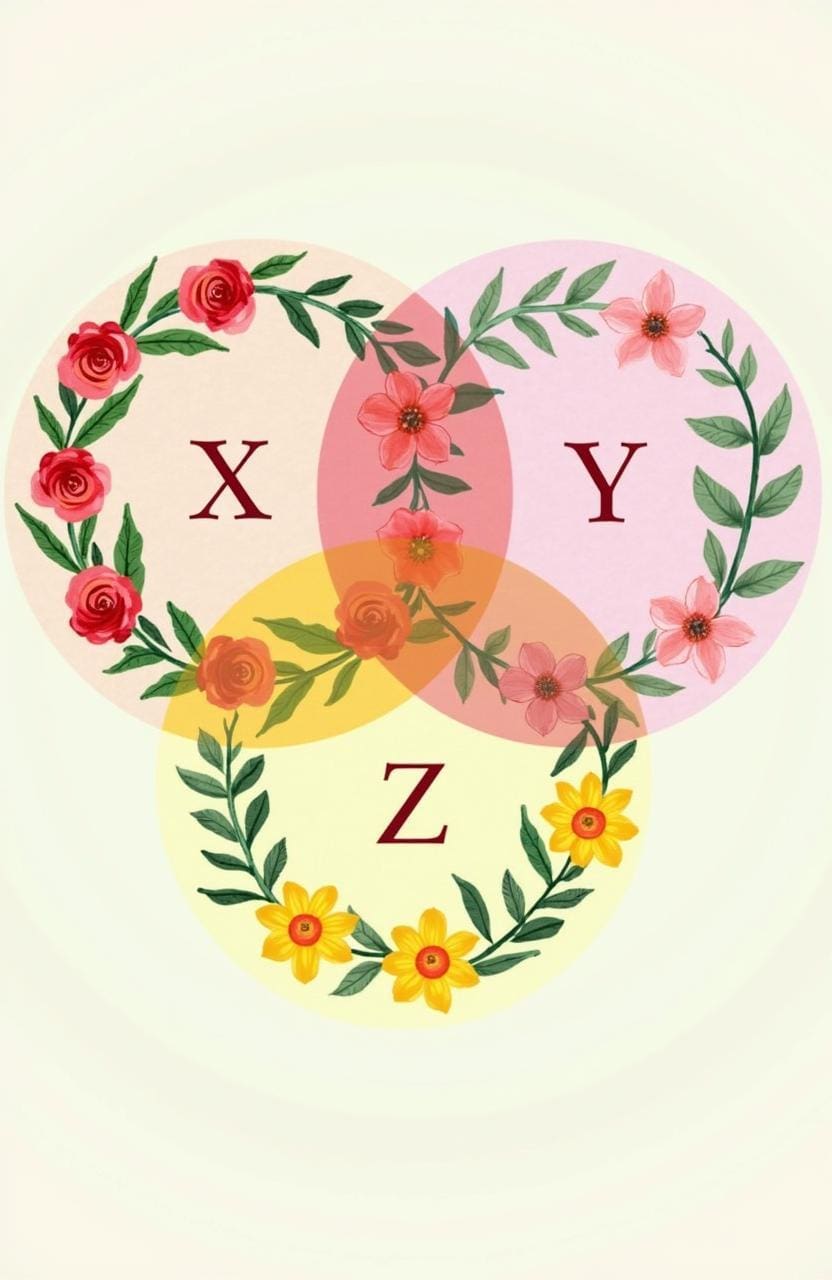
Create Stunning Venn Diagrams in Seconds
Unlock the power of visualization with our intuitive Venn Diagram Maker. Ideal for educators, professionals, and students — no design skills required.
★★★★★
30,000+ users

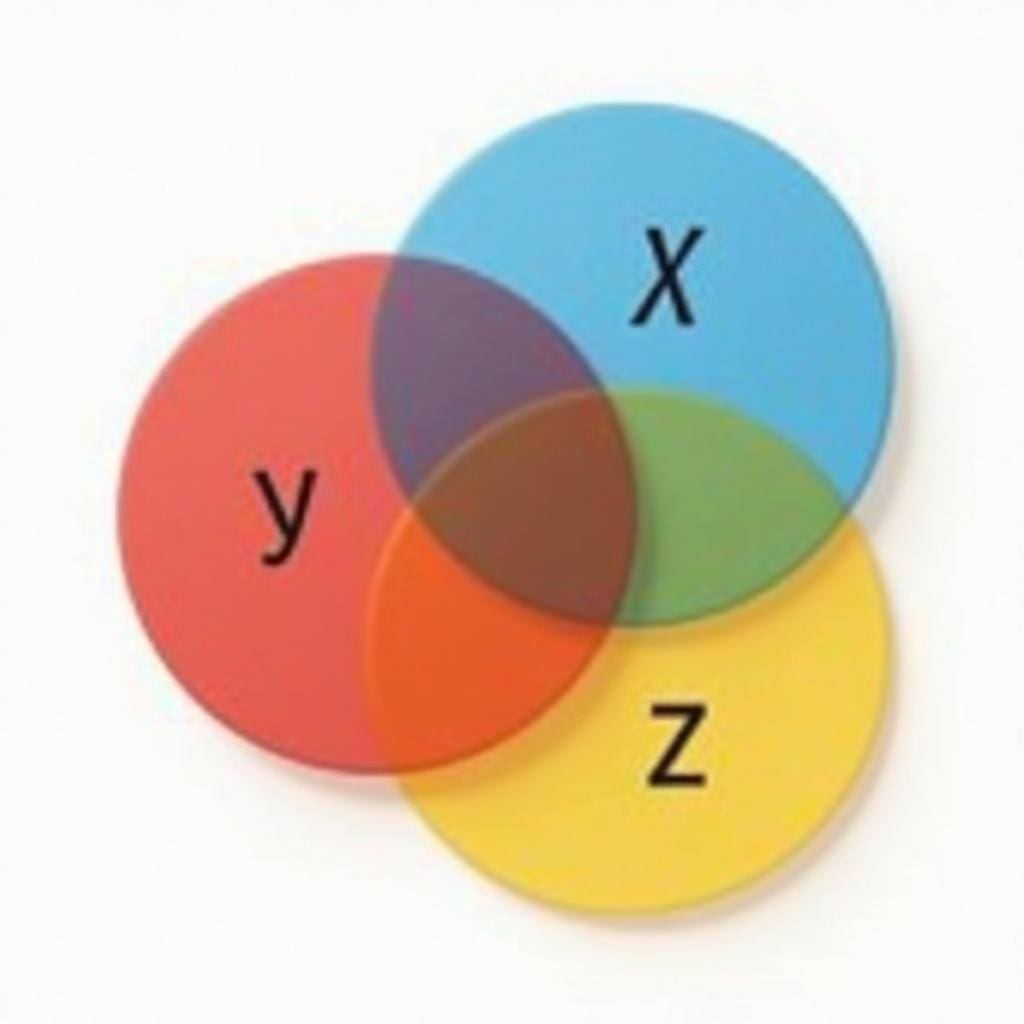
Visualize Relationships and Data with Ease
Our Venn Diagram Maker makes it simple to create professional-quality diagrams that display the relationships between different sets. Whether you need a diagram for a presentation, an educational project, or a data analysis task, our tool has you covered.
Text-to-Image Generation
Generate your Venn diagrams effortlessly from text descriptions. Just describe your sets and their relationships, and let our advanced technology do the rest. Perfect for creating clear and precise visuals without delving into manual design.
Customizable Quality and Speed
Choose the level of detail and resolution that best fits your needs. Our Venn Diagram Maker accommodates high-quality outputs for detailed presentations and faster, lower-quality options for quick drafts.
Iterate and Refine
Need to tweak a diagram? No problem. Use our iterative creation process to refine your diagrams with ease. Make specific changes to tailor the visuals exactly to your requirements.
Remix and Blend Diagrams
Combine elements from up to nine different diagrams to create complex visuals. Use inspiration images to guide the design and achieve the perfect look and feel for your project.
Auto-Edits for Specific Use Cases
Quickly adapt and edit your Venn diagrams for specific contexts, ensuring they are always relevant and impactful.
Join a Creative Community
Explore a feed of Venn diagrams created by others. Get inspired, share your own work, and engage with a vibrant community of visual thinkers. Comment, like, follow, and build connections with fellow users.
Publish and Share with Ease
Showcase your workflow and final diagrams by publishing threads that highlight your creative process. Share your knowledge and gain recognition within the community.
Frequently asked questions
What makes a good Venn diagram?
A good Venn diagram clearly shows the relationships between different sets, is easy to understand, accurately represents data, and is visually appealing.
Why use Venn diagrams?
Venn diagrams are powerful tools for:
- Visualizing relationships and intersections between different sets
- Simplifying complex information
- Enhancing presentations and reports
- Facilitating data analysis and decision making
Ready to Get Started?
Join The Community of over 30,000 Artists already using Idyllic